Foundation Models Won Time Series. Now Picking One Is the Hard Part
Key Takeaways
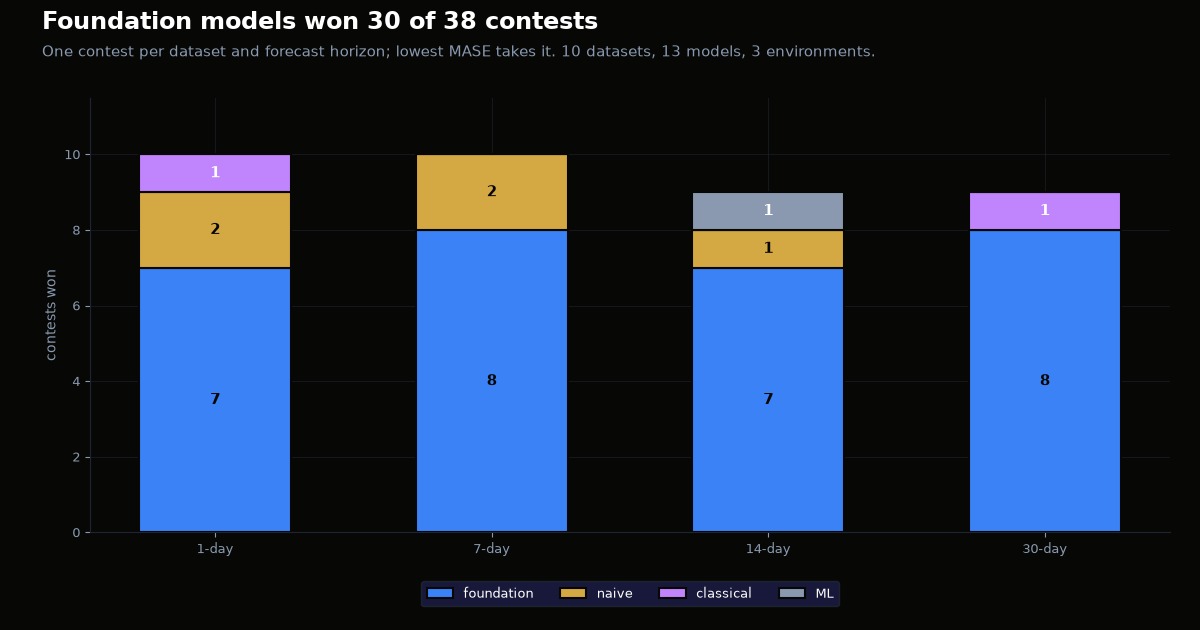
The adoption argument is over. I ran every model against every dataset at every horizon — 38 separate contests. Foundation models won 30. Classical statistics won 2. If you’re still benchmarking one against AutoETS to decide whether to adopt, you’re answering last year’s question.
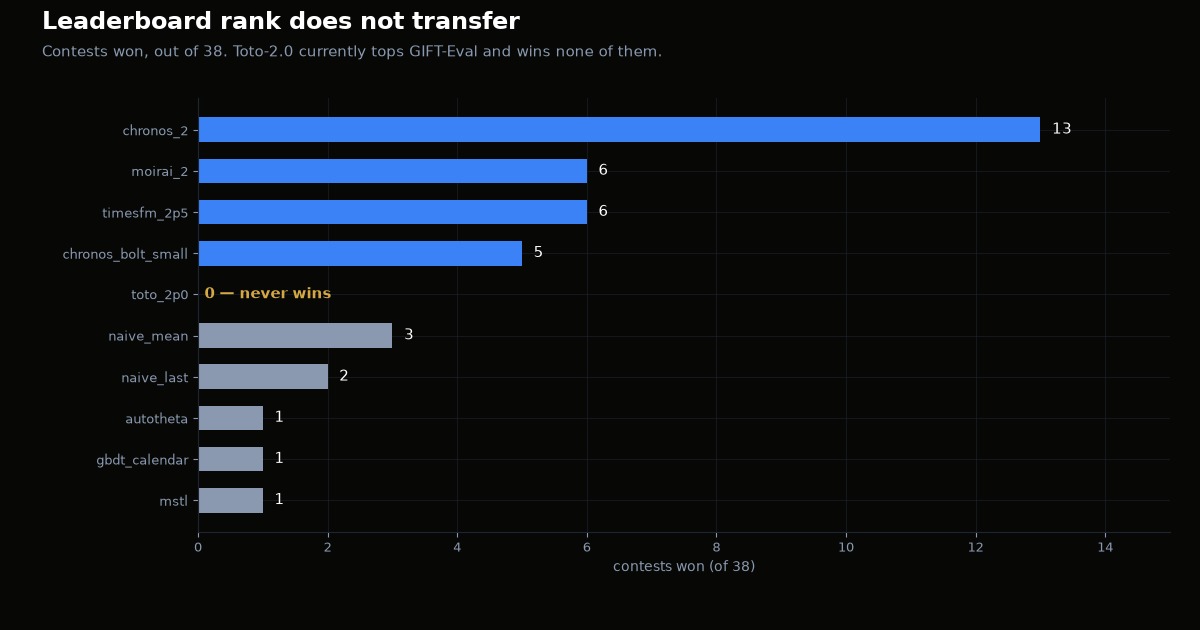
Leaderboard rank doesn’t transfer to your data. Toto-2.0 currently tops GIFT-Eval. Here it entered all 38 and won none, with a mean rank of 9.8 out of 13. Chronos-2 won 13.
Your forecast horizon flips the answer more than your dataset does. On Bangkok air quality, a one-line baseline beats every foundation model at day-ahead — then loses to them at 7, 14 and 30 days. Publish only the day-ahead number and you tell the opposite story.
Nobody writes down the engineering cost. Toto and Moirai can’t share a Python environment with TimesFM. Both pin numpy back to 1.26, and NumPy 2.0 broke the C ABI. Assembling the full field took three virtualenvs and a scorer that needs none.
My take: adoption is settled, selection isn’t. The skill worth building is measuring your own series at your own horizon, because no public ranking will do it for you.
On ownership: Chronos is an Amazon model and it wins more of these than anything else. Toto and Moirai are only in the field because I went to the trouble of isolating them. Both are reasons to check my work rather than trust it — the code, the datasets and every individual number behind these results are in the repo.
The Pitch Lands Hard If You’ve Lived It
I’ve inherited more than one forecasting stack that was really a model farm. One model per SKU, per store, per circuit. Thousands of them. Each individually defensible, and collectively a retraining bill nobody wanted to own.
So when someone tells me a single pretrained model can forecast a series it has never seen, from a bare array of floats, with no per-series fitting — that pitch lands hard.
Then I tried to verify it, and hit a wall.
Why Most Zero-Shot Numbers Can’t Be Checked
Most published zero-shot results are unverifiable, and it isn’t the authors’ fault. It’s a data problem.
TimesFM 2.5’s model card is unusually honest about its pretraining: GiftEvalPretrain, Wikimedia pageviews through November 2023, Google Trends through 2022, plus synthetic data. GiftEvalPretrain alone is 88 datasets and 230 billion data points.
Now benchmark that model “zero-shot” on ETTh1, or a Monash series that’s been public since 2016. Are you measuring forecasting skill, or recall?
You can’t tell. Nobody can.
The field knows. TIME, accepted at ICML 2026, exists specifically to rebuild benchmarks from data no model could have trained on.
So I built around that constraint, then made it harder three ways: more models, some data with nothing in it to find, and — the axis that mattered most — more than one forecast horizon.
How I Set It Up
Ten datasets, nine of them windowed to 2026, which is after every cutoff on the TimesFM card. ETTh1, Electricity, Traffic and Monash are deliberately absent. They’ve been public too long to separate skill from memory.
Three of the ten have no trend and no seasonality on purpose: Bitcoin hourly log returns, 2,657 consecutive USGS earthquake magnitudes indexed by event order, and seeded Gaussian noise. Those are the control. If a model shows a big advantage there, my harness is leaking and I need to find the leak before I believe anything else.
Four horizons — 1, 7, 14 and 30 days. These aren’t round numbers, they’re decisions. Day-ahead is the energy auction and the public-health advisory. Seven days is unit commitment and rostering. Fourteen is gas nomination and hedging. Thirty is fuel procurement and budgeting. Each horizon is specified in days and converted per dataset frequency, so “7-day” means the same decision on 30-minute demand data as on hourly air quality.
Thirteen models. Five foundation models — TimesFM 2.5, Chronos-2, Chronos-Bolt, Toto-2.0, Moirai-2. Three classical — AutoETS, AutoTheta, MSTL. One gradient-boosted tree on calendar features. Four naive baselines.
Pair each dataset with each horizon and you get one contest: all thirteen models forecasting the same series, from the same starting points, over the same distance. Lowest error takes it. That’s the unit I count wins in from here on.
Ten datasets × four horizons is 40. Two of those contests can’t exist — BOOM only carries 14 days per series, so there’s no 14- or 30-day forecast to score, and they’re skipped rather than fudged. That leaves 38.
The Environment Problem Nobody Writes Down
Two of these models can’t be installed next to the others, and I’ve never seen a paper mention it.
Toto and Moirai both pin numpy back to 1.26. NumPy 2.0 changed the C ABI, so extensions compiled against 2.x simply won’t load against 1.26. That’s binary incompatibility, not a version-label disagreement, and there’s no resolver flag that talks you out of it.
So each family gets its own virtualenv and writes forecasts to disk. A separate scorer reads those files and computes every metric while importing no model code at all. That last detail matters more than it sounds: metric definitions live in exactly one place, and no model family can be scored under its own conventions.
If you’re planning a foundation-model evaluation this quarter, budget for environment isolation before you budget for GPU time. It’s the part that will actually stall you. Exact pins, the two Apple Silicon gotchas, and the forecasts-on-disk contract are all in the repo README.
The Adoption Argument Is Over
One note on the metric first, because it decides everything downstream. I use MASE. It scales each origin’s error by the in-sample error of the seasonal naive on that origin’s own context, so 1.0 always means “no better than the naive.”
MAPE appears nowhere here. It’s arithmetically invalid on five of the ten series — both temperature series are an interval scale where zero is just a convention, and BTC returns, white noise and BOOM all cross zero. Leading with a MAPE table would have been the natural choice, and meaningless.
Here’s which family produced the lowest MASE across all 38 contests:
| family | contests won |
|---|---|
| Foundation | 30 |
| Naive | 5 |
| Classical | 2 |
| ML (GBDT) | 1 |
Aggregates hide where the wins sit, so here is every contest individually. Hover or tab any cell to read it: the dataset, the horizon, which model won, its MASE, and how far ahead of the runner-up it finished. Every value is read from the same results file the figures above are drawn from, so this figure cannot drift from the numbers in the text.
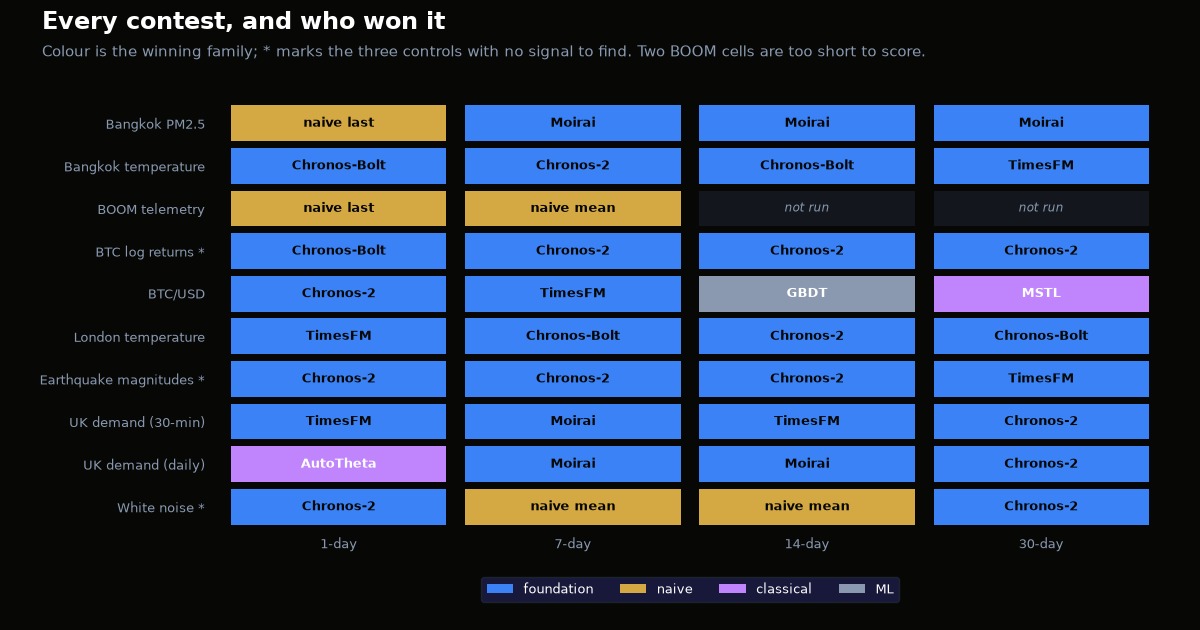
Two things are easier to see than to say. The naive wins cluster rather than scatter, which is the whole “don’t buy” case in one glance. And AutoETS — the default comparator in most vendor decks — never won a single contest. Neither did the seasonal naive.
A year ago I’d have pushed back on this hard. The data isn’t ambiguous.
Your Horizon Decides the Winner
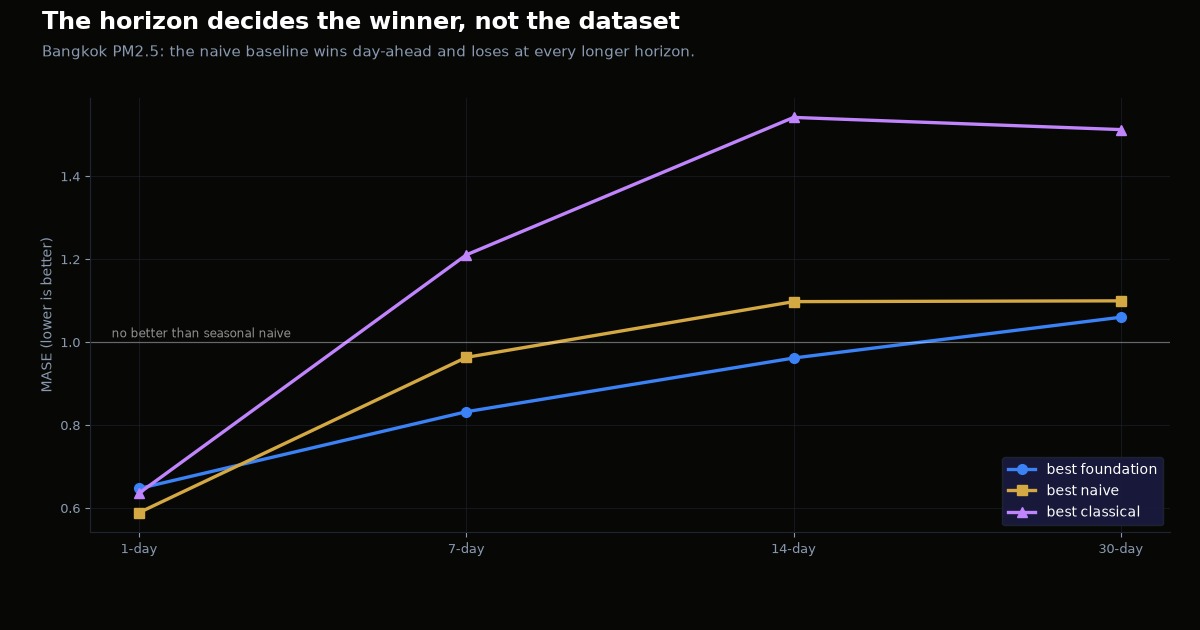
This is the finding that reorganised the whole study. I had it backwards going in.
Bangkok PM2.5 is the one dataset where foundation models lose at day-ahead. Seasonal strength is only 0.37, the distribution is heavy-tailed, and pollution surges dominate the error. Surges aren’t predictable from history, so between them, persistence is the best answer available.
I assumed the naive baseline’s advantage would grow with horizon. Persistence degrades gracefully, right?
Wrong:
| horizon | best foundation | best naive | winner |
|---|---|---|---|
| 1-day | 0.647 | 0.589 | naive_last |
| 7-day | 0.833 | 0.964 | Moirai-2 |
| 14-day | 0.962 | 1.098 | Moirai-2 |
| 30-day | 1.060 | 1.100 | Moirai-2 |
Persistence doesn’t degrade gracefully over a week. It collapses. Today’s PM2.5 tells you nothing about next Thursday. The foundation models fall back on the daily cycle — weak, but real — and that’s enough to win. By day 7, naive_last has crossed 1.0, which means it’s now worse than the seasonal naive it’s measured against.
The crossover sits somewhere between 1 and 7 days. I haven’t pinned it down, and that’s exactly the measurement a team should run on their own data.
Here’s why this should bother you about benchmark culture generally. A single-horizon benchmark — which is nearly all of them — measures one point on a curve and reports it as a property of the model. If I’d published only the day-ahead column, my headline would have been “one-line baseline beats five state-of-the-art foundation models.” Completely true. Completely misleading.
The Leaderboard Won’t Shortlist For You
| model | contests won (of 38) |
|---|---|
| Chronos-2 | 13 |
| TimesFM 2.5 | 6 |
| Moirai-2 | 6 |
| Chronos-Bolt | 5 |
| Toto-2.0 | 0 |
Toto-2.0 currently tops GIFT-Eval. Here it ran in all 38 contests, won none, and landed a mean rank of 9.8 out of 13 — best rank 4, worst 13.
Let me be careful about what this does and doesn’t show. It isn’t evidence that Toto is a bad model, and GIFT-Eval isn’t wrong. It’s evidence that a ranking computed on one benchmark’s data, at one horizon, doesn’t predict performance on your data at your horizon. Those are two different quantities, and our industry routinely treats them as one.
There’s a wrinkle that makes it stranger. BOOM, one of the datasets here, is Datadog’s own benchmark, and Toto trains on Datadog telemetry. This is home turf.
Where the Dumb Baseline Still Wins
Five contests went to a naive baseline, and they cluster tightly. BOOM telemetry at 4 hours and 7 days, where observability data is dominated by persistence at short range and surges reaching 245× the interquartile range aren’t forecastable by anything. White noise at 7 and 14 days, where naive_mean is the theoretically optimal answer and the foundation models land within 1% of it — the control working exactly as designed. And Bangkok PM2.5 at day-ahead.
That’s the honest core of the “don’t buy” case, and it’s narrow: weakly seasonal, heavy-tailed, short horizon. If that’s your series, measure before you spend. If it isn’t, the foundation models will probably win.
Bitcoin is worth a mention as the control that holds across horizons. MASE degrades 0.565 → 1.685 → 2.824 → 4.832 as the horizon grows, and the winner drifts from Chronos-2 to TimesFM to a GBDT to MSTL. Nobody has skill on a random walk at 30 days — and reassuringly, the models converge to worthless together instead of one of them inventing structure.
The Interval Nobody Should Trust Yet
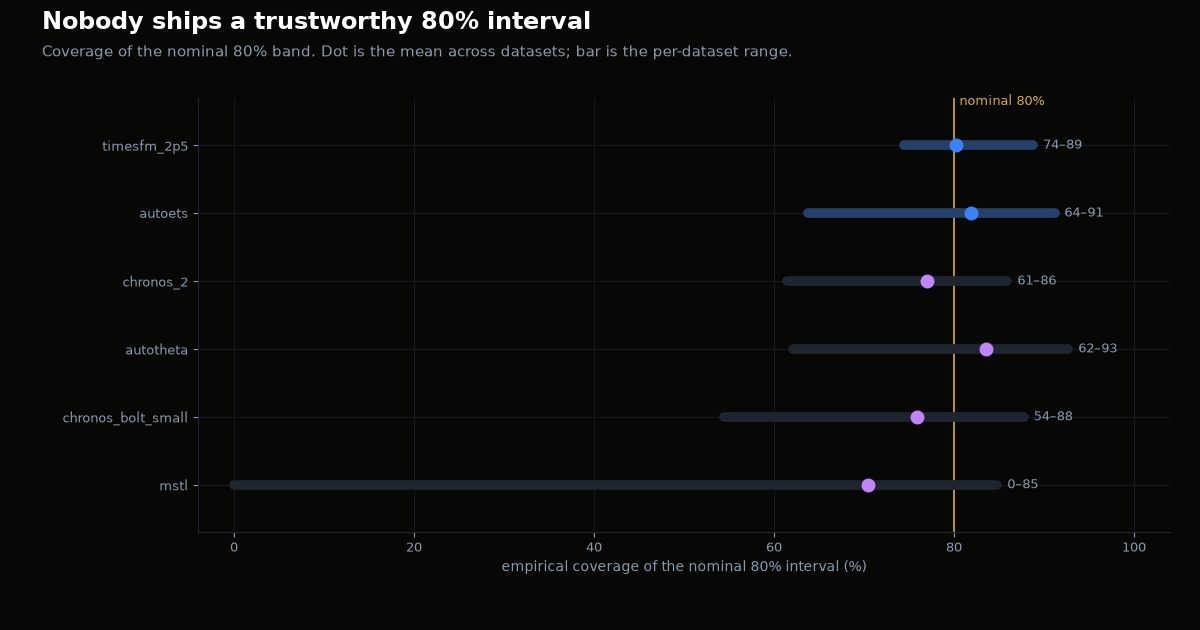
Everything above is about the point forecast. If your decision hangs on the interval — a reserve margin, a safety stock, a staffing buffer — you need to know how much of the truth actually lands inside the 80% band you asked for.
Not enough of it, is the answer.
TimesFM looks perfectly calibrated on average: 80.2% coverage against a nominal 80%. Per dataset it swings between 74% and 89%. Chronos-Bolt ranges from 54% to 88%. MSTL averages 70% and hits zero coverage on one series — an interval that contained none of the actuals, while still reporting a number.
That’s the same trap as the single-horizon benchmark, one level down. A mean that looks right, hiding a spread that isn’t. If I’d published the mean column alone, TimesFM would look solved.
Coverage was only recorded in the single-environment run, so this covers six models rather than thirteen — Toto and Moirai aren’t in it. Treat it as directional. The direction is clear enough: conformalise on a holdout before you let an interval drive a decision.
Five Things to Check Before You Call the Model
A foundation model takes a bare array of floats. No timestamps, no schema, no complaints. That’s exactly why it’s easy to hand it something quietly wrong and get a plausible forecast back.
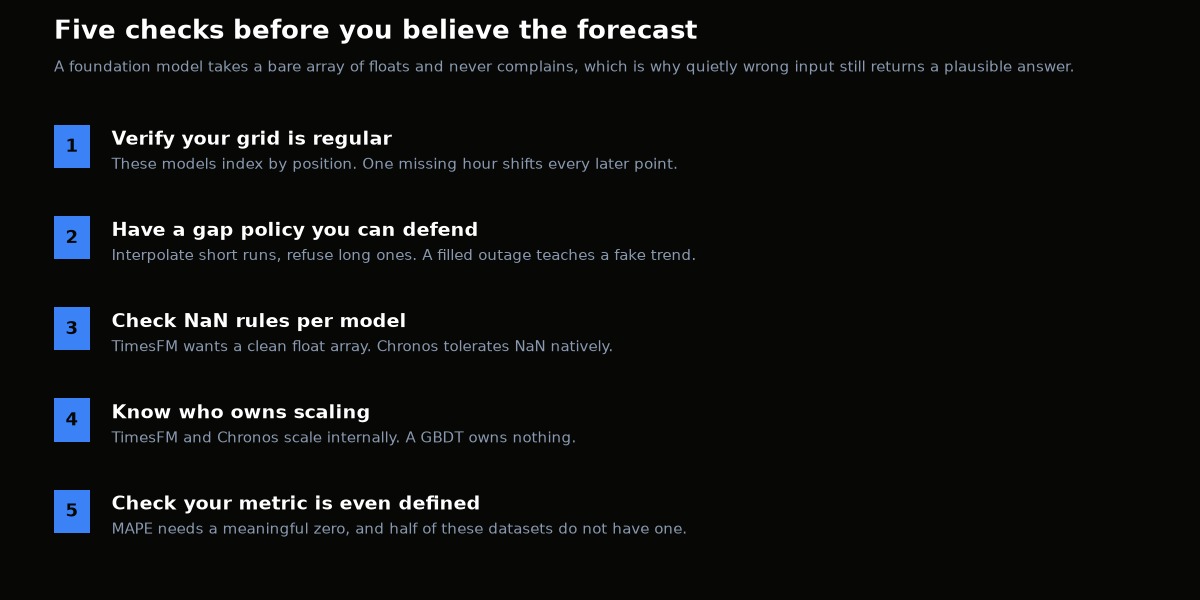
In more detail, and in the order they tend to bite:
- Verify your grid is regular. These models index by position. One missing hour shifts every later point in model-time and corrupts the periodicity the model is trying to use.
- Have a gap policy you can defend. I interpolate runs of up to three steps and refuse anything longer. Fill a multi-day outage with a straight line and you’ve taught the model a trend that never happened.
- Check NaN rules per model. TimesFM wants a clean float array. Chronos tolerates NaN natively. Same series, different rules.
- Know who owns scaling. TimesFM and Chronos scale internally. A GBDT owns nothing. Pre-scaling the first two is double work that can hurt you; not scaling the third is a bug.
- Check your metric is even defined. MAPE needs a ratio scale with a meaningful zero, and it doesn’t have one on half my datasets.
Two bugs from my own harness are worth your time, because both produced confident, plausible numbers before I caught them. A flat 2,048-point context on a 553-observation daily series left exactly one usable origin — that dataset quietly contributed 10 forecasts instead of 176, and its entire row was one lucky day. Then one of the isolated runners reloaded series from cache itself and forecast all 24 BOOM series concatenated into a single sequence. The numbers looked fine. They were for the wrong data.
Neither was caught by a test. Both were caught by a number that looked slightly too good. The fix was architectural rather than a patch: the truth file now carries the exact context window per origin, and the satellite environments never touch raw data at all.
What I’d Do Monday
Measure your series at your horizon. Fit an STL, get seasonal strength and spectral entropy, then evaluate at the horizon your business actually decides on. Both halves matter — this study’s headline flips between day 1 and day 7 on the same data.
Stop benchmarking against AutoETS to justify adoption. It won zero of 38 contests. Spending a quarter re-answering that question is the expensive mistake now.
Make the naive baseline a gate, not a footnote. MASE below 1.0 is the bar. Then pick the right naive: last value for a random walk, mean for stationary noise, seasonal lag for a load curve.
Ignore leaderboard rank when shortlisting. Take the top three or four and measure them yourself.
Budget for calibration, not just inference. Nothing here delivered a trustworthy 80% interval across the board. Conformalise on a holdout before an interval drives a decision.
What Would Change My Mind
Sixteen origins per contest is enough to rank models, not enough to separate two within a few percent — treat any gap under about 5% as a tie. Long horizons eat the series, so on the 129-day datasets the 30-day contests run few origins and are directional only. The BOOM figures cover one sampled series per contest, and one series is not a panel.
One asymmetry to hold in mind when reading the win counts: TimesFM is missing from two contests — one BOOM series and the 30-day UK demand contest — from runner failures I’ve left visible rather than papered over. So its 6 wins came from 36 contests while Chronos-2’s 13 came from 38. That doesn’t change the ordering, but it isn’t a like-for-like denominator, and Toto’s zero is from a full 38.
What would genuinely change my mind: a fine-tuned run, and a properly engineered global GBDT with years of history and promotional features. That’s the real incumbent in retail and utilities, and it isn’t in this study — which is the most likely way my conclusion is overstated.
The Bottom Line
Foundation models have won on the question that was actually being debated. They beat the classical stack comfortably, across most data and most horizons. AutoETS won nothing.
What replaced that debate is harder and gets far less airtime. The best model on the public leaderboard won nothing here. The winner changed with the forecast horizon on the same dataset. And assembling an honest field took three Python environments that can’t see each other.
Adoption was the easy part. Selection is the work.
Reproduce it — github.com/netsatsawat/tsfm-bakeoff: it fetches all ten datasets with no API keys, builds one virtualenv per model family, and scores every contest with a scorer that imports no model code. Full per-contest results, methodology and the environment gotchas are in the README.
Sources: TimesFM (ICML 2024), TimesFM 2.5 model card, GIFT-Eval, TIME benchmark (ICML 2026), BOOM / Toto (NeurIPS 2025), Toto 2.0, NESO, Open-Meteo, USGS.